The EUR/USD currency pair traded again with low volatility and a slight downward bias on Wednesday. Over the past few days, the euro has been sliding down like a sled on a snowy mountain, pushing its feet into the snow. The force of gravity pulls the euro down, but it is resisting with all its might. The macroeconomic and fundamental background was absent on Wednesday, but the Middle East flared up again early in the morning. And this time, it flared up quite seriously.
It all started on Tuesday with yet another attack by Iran on commercial vessels passing through the Strait of Hormuz. Traders saw firsthand how safe and open this strait is for all who wish to use it. It is no surprise that most shipowners prefer to wait rather than send their vessels through Iran's coastal waters. The problem this time is extremely simple: Iran believes that all vessels passing through Hormuz must do so strictly via certain routes and within Iran's territorial waters. As a reminder, Tehran plans to impose a fee for passing through the Strait of Hormuz in a month and a half, so every vessel must remain under control. However, several ships attempted to pass near Oman, on the other side of the strait, and... were hit by missile attacks. A total of three tankers were damaged, prompting the U.S. to respond with its own strike.
The strike was naturally directed at Iranian military infrastructure, and just a few hours later, Iranian missiles flew toward U.S. military bases in Kuwait and Bahrain. Essentially, this sums up the realities of various ceasefires, agreements, and memoranda between Iran and the U.S. Tehran and Washington have barely signed a memorandum before violating it several times. Each side blames the other for the breakdown of agreements. Participants in the conflict have only coordinated a basic set of ceasefire terms that would allow for discussions of more critical issues, but they cannot even adhere to those. Therefore, any future negotiations between Iran and the U.S. will appear merely as a theatrical performance.
Donald Trump, meanwhile, could not tolerate Iran's new audacity and declared the ceasefire over. Naturally, this statement should be regarded just as skeptically as the previous claims about achieving peace. In just a few days, the U.S. president may declare that the conflict is settled: both sides have agreed to a ceasefire for the tenth time, an agreement will soon be signed, and America will get what it wants, having already defeated its enemy. The market knows and understands all of this, so the reaction to the new escalation in the Middle East was formal—the U.S. dollar appreciated by just a few dozen points. Traders remember that the next round of negotiations is scheduled for June 11, so there could be no contacts between Iranian and American delegations before that date. Up until June 11, both sides may exchange a few more shots.
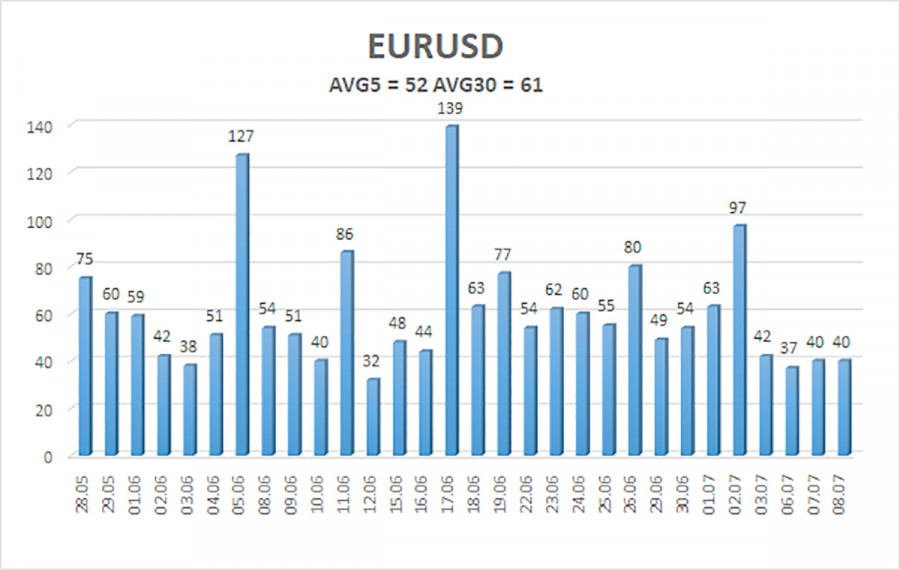
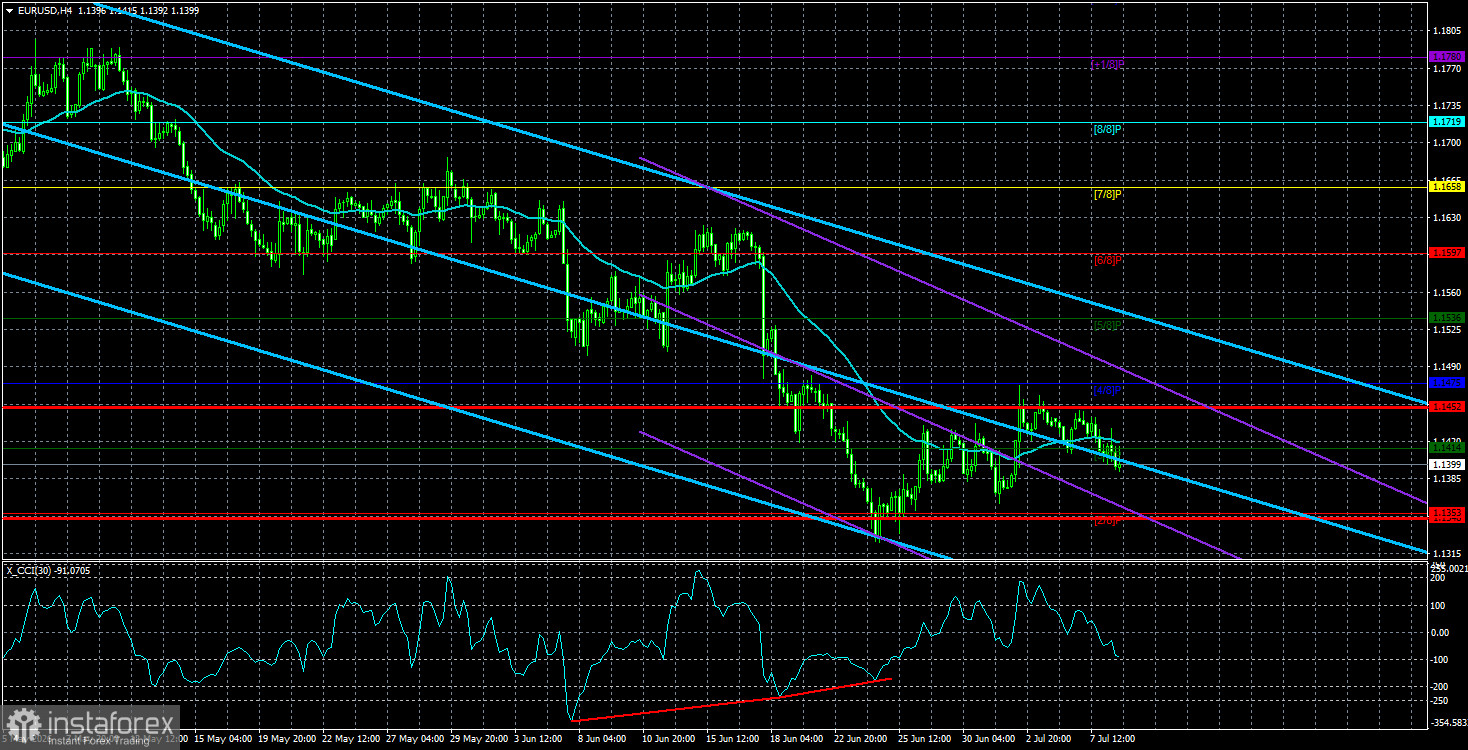
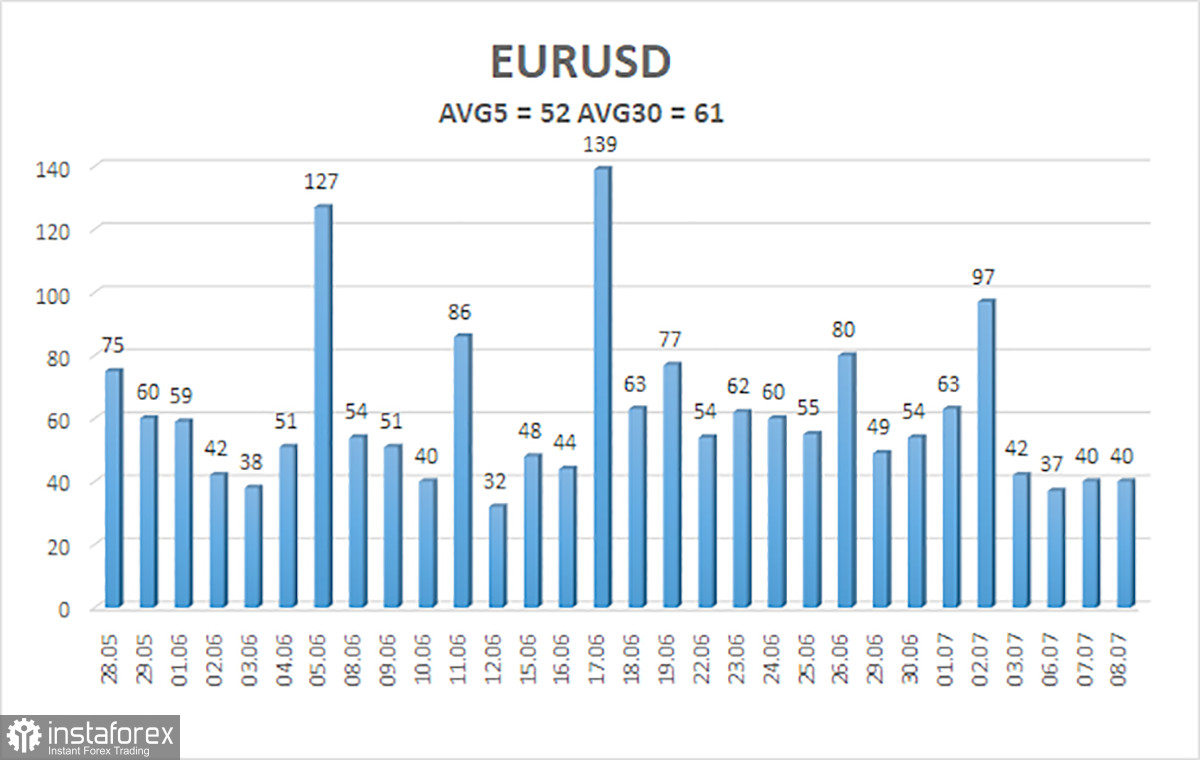
The average volatility of the EUR/USD currency pair over the last five trading days as of July 9 is 52 pips, which is considered "average." We expect the pair to move between levels 1.1348 and 1.1452 on Thursday. The upper linear regression channel has turned downward, indicating the continuation of the bearish trend. The CCI indicator has entered the oversold area and formed two bullish divergences, warning of a possible end to the downward trend.
Nearest Support Levels:
- S1 – 1.1353
- S2 – 1.1292
- S3 – 1.1230
Nearest Resistance Levels:
- R1 – 1.1414
- R2 – 1.1475
- R3 – 1.1536
Trading Recommendations:
The EUR/USD pair maintains a downward trend, presumed to be a correction within a global upward trend, as is evident on the daily and weekly timeframes. The global fundamental backdrop for the dollar remains negative, but in 2026, geopolitical factors, first and foremost, and then the Federal Reserve's hawkish stance have provided substantial support for the American currency. If the price is below the moving average, consider short positions targeting 1.1353 and 1.1292. Long positions are relevant above the moving average with targets of 1.1475 and 1.1536. Bears are currently very strong for no visible reason.
Explanations to Illustrations:
- Linear Regression Channels help determine the current trend. If both are pointing in the same direction, it indicates a strong trend.
- Moving Average Line (settings 20.0, smoothed) defines the short-term trend and the direction in which trading should be conducted.
- Murray Levels indicate target levels for movements and corrections.
- Volatility Levels (red lines) indicate the probable price channel in which the pair will operate in the next day based on current volatility indicators.
- CCI Indicator: Its entry into the oversold zone (below -250) or the overbought zone (above +250) indicates that a trend reversal may be approaching in the opposite direction.