EUR/USD
Analysis:
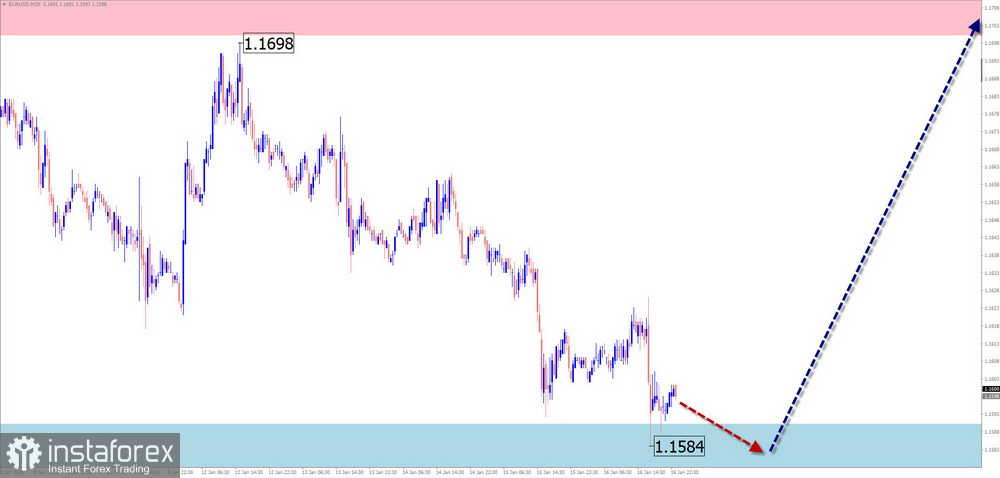
Since December of last year, a descending shifting flat has been developing on the chart of the major euro pair. The price decline has brought quotes to the upper boundary of a powerful, potentially reversal zone on the weekly chart. No signals of an immediate reversal are currently observed.
Forecast:
Throughout the coming week, there is a high probability that the euro price will continue an overall sideways movement. In the next couple of days, pressure on the support zone can be expected. A short-term break below its lower boundary is possible. Subsequently, a return of the price into the range between the nearest zones is expected, with a gradual rise toward the resistance level.
Potential Reversal Zones
Resistance:
Support:
Recommendations:
Sell: Low potential, high risk.Buy: Will become possible after corresponding reversal signals appear on the trading systems used.
USD/JPY
Analysis:
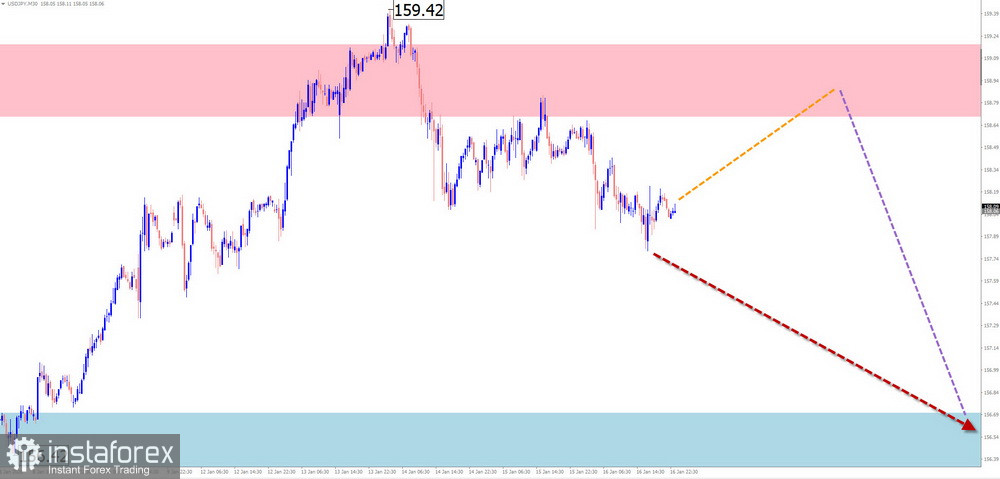
On the chart of the Japanese yen against the US dollar, an ascending wave zigzag has been developing since April of last year. Since December, prices have changed direction, forming a corrective phase on the chart. At present, the wave structure does not appear complete. The final segment (C) is still missing.
Forecast:
Over the next few days, sideways price movement along the calculated resistance zone is expected. Toward the end of the week, a reversal and renewed decline can be expected, with price movement down to the support zone. When the direction changes, a short-term break above the upper boundary of the control zone cannot be ruled out.
Potential Reversal Zones
Resistance:
Support:
Recommendations:
Buy: There are no conditions for such trades on this pair.Sell: Will become possible after confirmed reversal signals appear within the resistance zone.
GBP/JPY
Analysis:
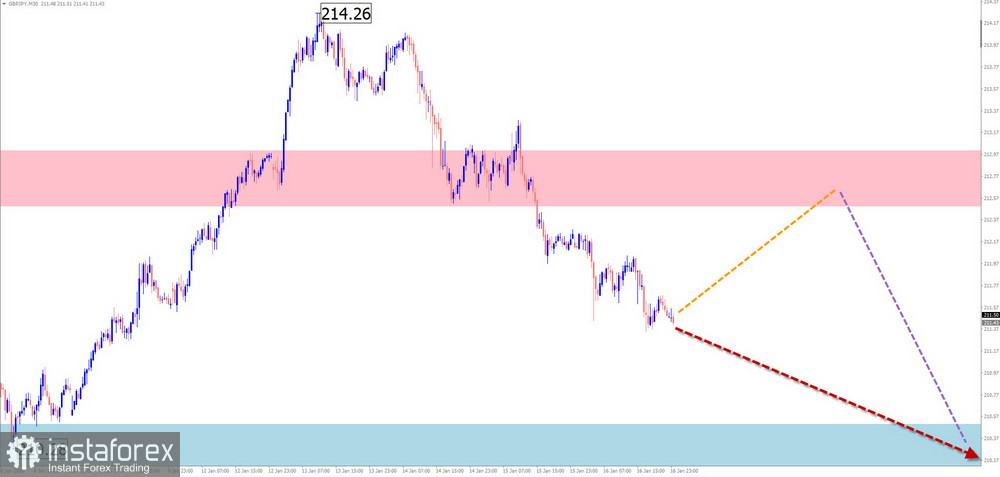
Since November of last year, an ascending wave has been forming on the chart of the GBP/JPY pair. The wave structure does not appear complete at this time; since mid-December, a corrective phase has been forming. At the time of analysis, the price has pushed below the lower boundary of the potential reversal zone.
Forecast:
A sideways bias is expected during the coming week, with a more likely upward vector. In the area of calculated resistance, a reversal and renewed decline can then be expected. The highest activity is likely toward the end of the week.
Potential Reversal Zones
Resistance:
Support:
Recommendations:
Buy: Low potential.Sell: After corresponding reversal signals appear in the resistance zone, they may be used in trading.
USD/CAD
Analysis:
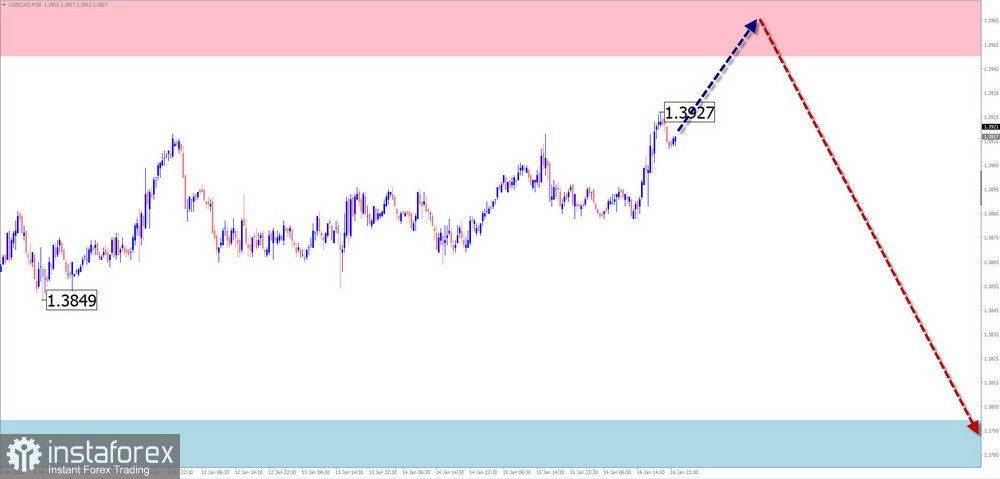
On the chart of the Canadian dollar major pair, a descending wave has been forming since November of last year. About a month ago, a counter corrective movement began to develop within the wave structure, in the form of an extended horizontal flat. At the time of analysis, this structure does not appear complete.
Forecast:
During the coming week, continuation of the upward movement bias can be expected, up to contact with the calculated resistance zone. In the first days, short-term pressure and a break above the upper boundary of the zone are possible. After that, a change in direction and a decline toward the support boundaries is expected. The highest volatility is likely toward the end of the week.
Potential Reversal Zones
Resistance:
Support:
Recommendations:
Buy: Low potential and may become unprofitable.Sell: May be used with reduced position size after corresponding signals appear near the resistance zone.
NZD/USD
Brief Analysis:
On the chart of the New Zealand dollar major pair, an ascending wave structure has been forming since April of last year. Since mid-November, prices have begun forming the start of the final segment (C). Over the past month, the price has been correcting, forming a shifting flat. The structure of this wave segment does not appear complete at the time of analysis.
Weekly Forecast:
With a high degree of probability, a completion of the decline, a reversal, and a price move toward the calculated resistance zone can be expected during the coming week. At the beginning of the week, short-term pressure and a break below the lower boundary of the support zone cannot be ruled out.
Potential Reversal Zones
Resistance:
Support:
Recommendations:
Sell: Limited by support in terms of potential; it is advisable to reduce position size.Buy: After confirmation in the form of corresponding signals on the trading systems you use, they may become the primary trading direction.
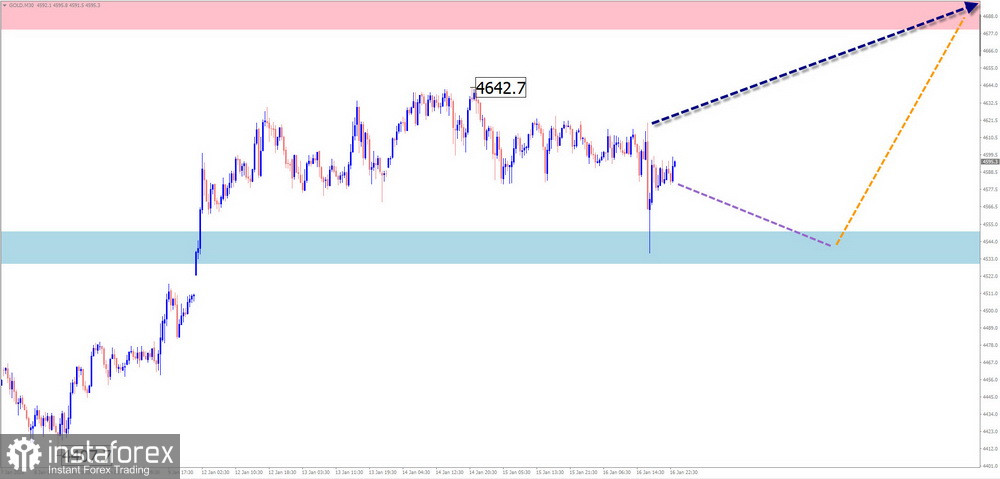
Gold
Analysis:
Since the end of October last year, gold prices have been forming a descending extended/shifting flat. Within the structure of a larger upward trend, this segment represents a correction. The price is moving within a flat price corridor along a potential reversal zone on the weekly chart.
Forecast:
During the coming week, continuation of the overall sideways movement in gold is expected. After probable pressure on the resistance zone, a reversal and gradual decline toward the support zone can be anticipated.
Potential Reversal Zones
Resistance:
Support:
Recommendations:
Buy: May be used with reduced position size within intraday trading.Sell: There are no conditions for such trades.
Explanations:
In simplified wave analysis (SWA), all waves consist of three parts (A–B–C). On each timeframe, the latest incomplete wave is analyzed. Expected movements are shown with dashed lines.
Attention:
The wave algorithm does not take into account the time duration of price movements of instruments.