برطانوی پاؤنڈ/امریکی ڈالر کا 5 منٹ کا تجزیہ
برطانوی پاؤنڈ/امریکی ڈالر کرنسی کے جوڑے نے منگل کو دوبارہ سمت تبدیل کی، کم ٹریڈنگ کی۔ مجموعی طور پر، برطانوی پاؤنڈ کے ساتھ جو کچھ ہو رہا ہے اسے "رولر کوسٹر"، "سیسو" یا "حیران کن" کے طور پر بیان کیا جا سکتا ہے۔ برطانوی کرنسی ہر 1-2 دن میں سمت بدلتی ہے، اور زیادہ تر حرکتیں سائز میں تقریباً برابر ہوتی ہیں۔ پیر کو، سٹرلنگ جیروم پاول کے خلاف مجرمانہ تحقیقات کی خبر پر بڑھ گیا، اور منگل کو، یہ مکمل طور پر غیر جانبدار امریکی صارف قیمت انڈیکس پر گرا۔ یہ سمجھنے کے لیے کہ کیا ہو رہا ہے، کسی کو روزانہ TF پر واپس آنا چاہیے۔ وہاں ہم دیکھتے ہیں کہ قیمت Ichimoku کلاؤڈ اور کریٹیکل لائن سے ٹوٹ گئی ہے، اس لیے مسلسل اضافے کا امکان زیادہ ہے۔ یہ صرف اتنا ہے کہ مارکیٹ ابھی تک اس طرح کی ترقی کے لئے تیار نہیں ہے۔ ہم یہ نہیں کہیں گے کہ نیا زوال ناممکن ہے لیکن ہمارے خیال میں یہ آپشن منطقی نہیں ہے۔
فی گھنٹہ TF پر، پاؤنڈ خریدنے کے لیے، Senkou Span B لائن کے اوپر وقفے کا انتظار کرنا چاہیے۔ کل، جوڑی نے اصل میں اس اہم لائن کو اچھال دیا. تاہم، اقتباسات میں کمی بہت قلیل مدتی ہو سکتی ہے، اور ایک واضح رجحان اب بڑی حد تک غائب ہے۔ ہر روز ایسی خبریں لاتی ہیں جن کی تشریح مشکل ہے۔ کل کی مہنگائی کی رپورٹ بھی مبہم تھی۔
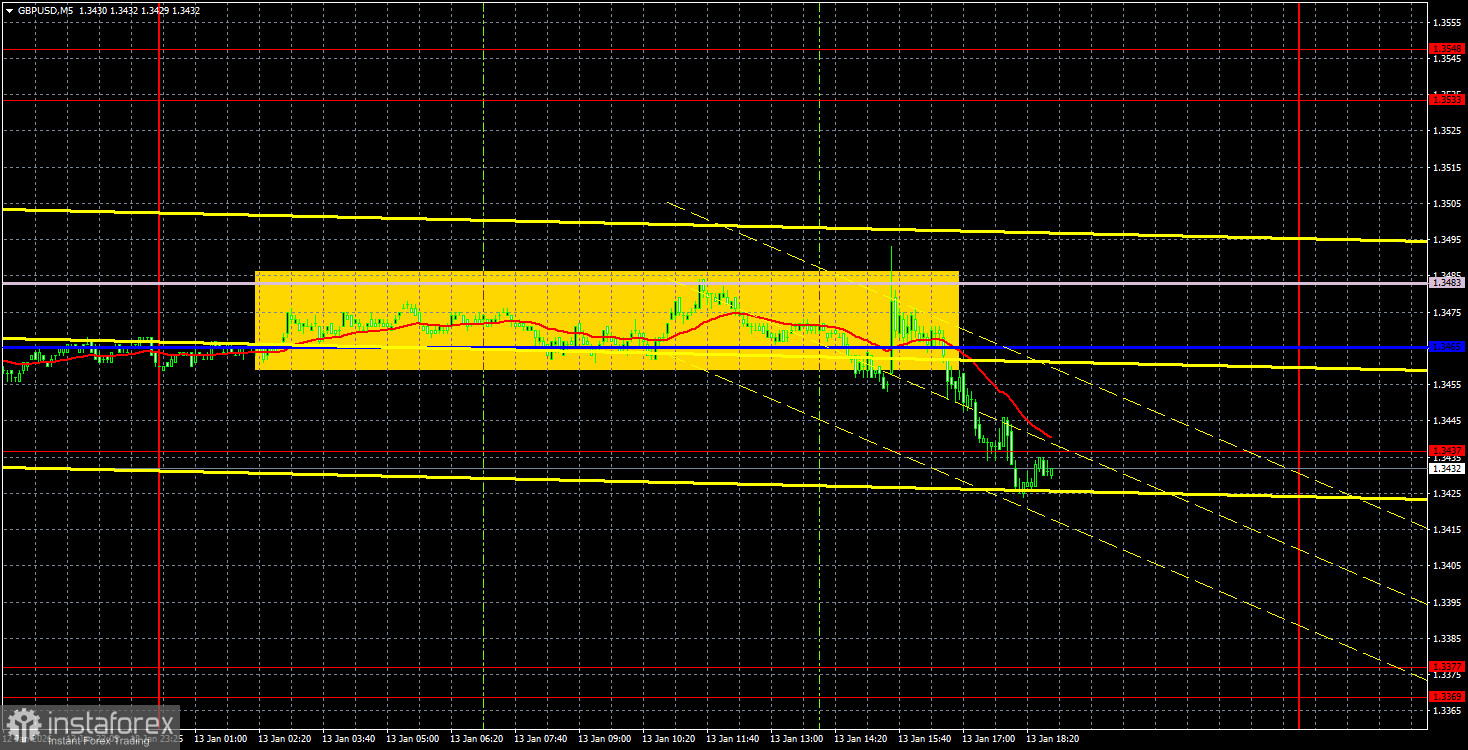
5 منٹ کے TF پر، برطانوی پاؤنڈ/امریکی ڈالر جوڑا، جیسے یورو/امریکی ڈالر، کم سے کم اتار چڑھاؤ کے ساتھ تجارت کرتا ہے اور منگل کے بیشتر حصے میں بنیادی طور پر ایک طرف۔ صرف امریکی سیشن میں اس نے Ichimoku انڈیکیٹر لائنز کے علاقے سے علیحدہ ہونے کا انتظام کیا، اس طرح فروخت کا سگنل بنا۔ قریب ترین ہدف صرف 17 پپس دور تھا اور یقیناً پہنچ گیا تھا۔ اس کے بعد، قیمتوں میں کمی مؤثر طریقے سے رک گئی۔
سی او ٹی رپورٹ
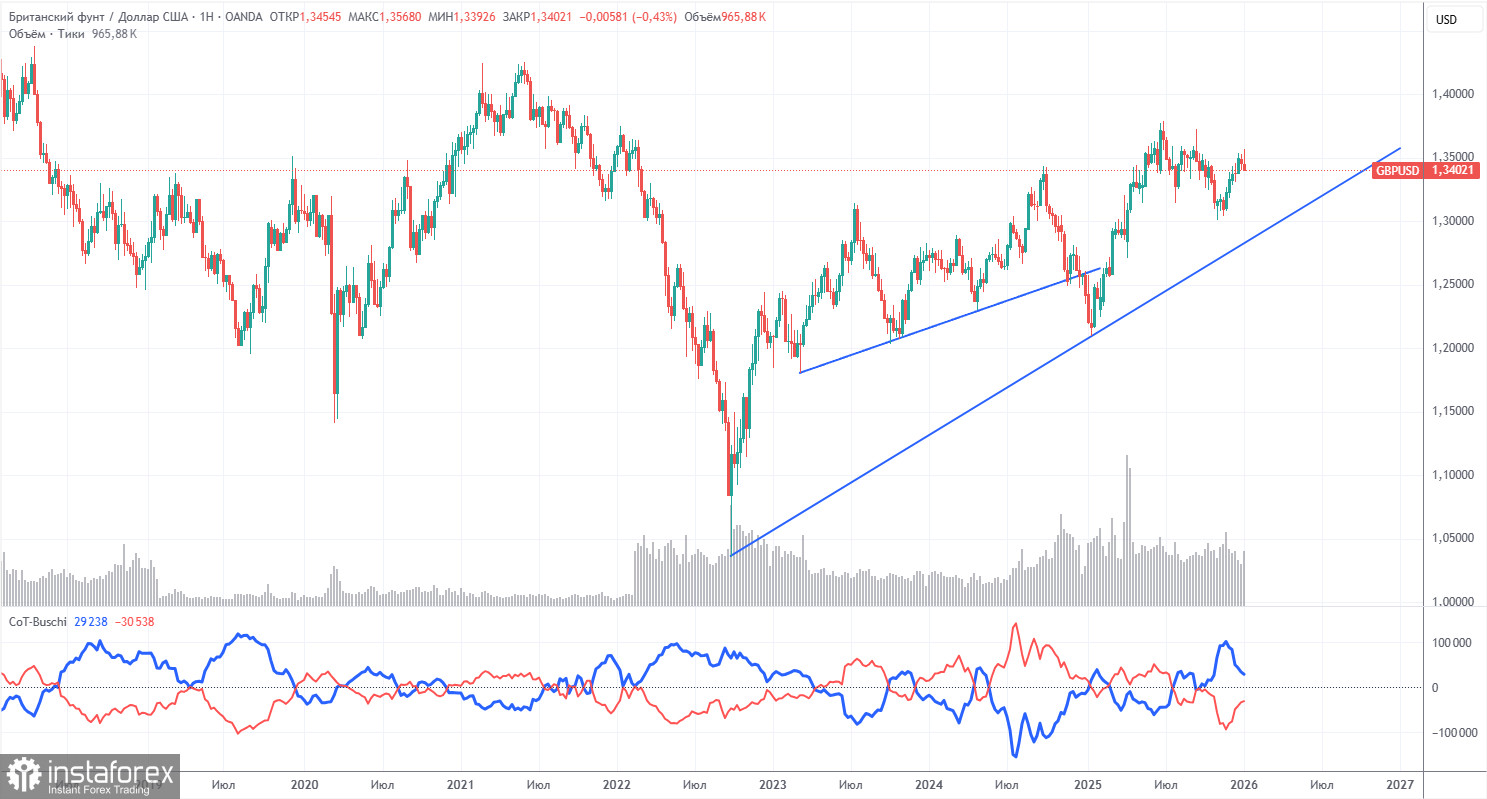
برطانوی پاؤنڈ کے بارے میں COT رپورٹیں ظاہر کرتی ہیں کہ حالیہ برسوں میں تجارتی تاجروں کے جذبات میں مسلسل تبدیلی آئی ہے۔ کمرشل اور غیر تجارتی تاجروں کی خالص پوزیشن کی نمائندگی کرنے والی سرخ اور نیلی لکیریں بار بار کراس کرتی ہیں اور عموماً صفر کے قریب ہوتی ہیں۔ اس وقت، لائنیں مختلف ہوتی جا رہی ہیں، لیکن غیر تجارتی تاجر اب... سیلز کے ساتھ حاوی ہیں۔ قیاس آرائی کرنے والے تیزی سے پاؤنڈ فروخت کر رہے ہیں، لیکن جیسا کہ ہم پہلے ہی کہہ چکے ہیں، اس سے کوئی فرق نہیں پڑتا کہ برطانوی کرنسی کی مانگ کتنی کم ہے — امریکی ڈالر کی مانگ اکثر اس سے بھی کم ہوتی ہے۔
ڈونالڈ ٹرمپ کی پالیسیوں کی وجہ سے ڈالر مسلسل گر رہا ہے، جیسا کہ ہفتہ وار TF (اوپر کی مثال) میں واضح طور پر دکھایا گیا ہے۔ تجارتی جنگ کسی نہ کسی شکل میں طویل عرصے تک جاری رہے گی، اور فیڈ، کسی بھی صورت میں، اگلے 12 ماہ کے اندر شرحوں میں کمی کرے گا۔ ڈالر کی مانگ کسی نہ کسی طرح کم ہو گی۔ برطانوی پاؤنڈ پر تازہ ترین COT رپورٹ (6 جنوری تک) کے مطابق، "نان کمرشل" گروپ نے 700 BUY معاہدے اور 4,300 SELL معاہدے کھولے۔ اس طرح، غیر تجارتی تاجروں کی خالص پوزیشن میں ہفتے کے دوران 2,700 معاہدوں کا اضافہ ہوا۔
2025 میں پاؤنڈ کی قدر میں کافی اضافہ ہوا، لیکن وجہ ایک ہے: ڈونلڈ ٹرمپ کی پالیسی۔ ایک بار جب اس وجہ کو بے اثر کر دیا جائے تو، ڈالر ترقی کی طرف لوٹ سکتا ہے، لیکن کوئی نہیں جانتا کہ کب۔
برطانوی پاؤنڈ/امریکی ڈالر کا 1 گھنٹے کا تجزیہ
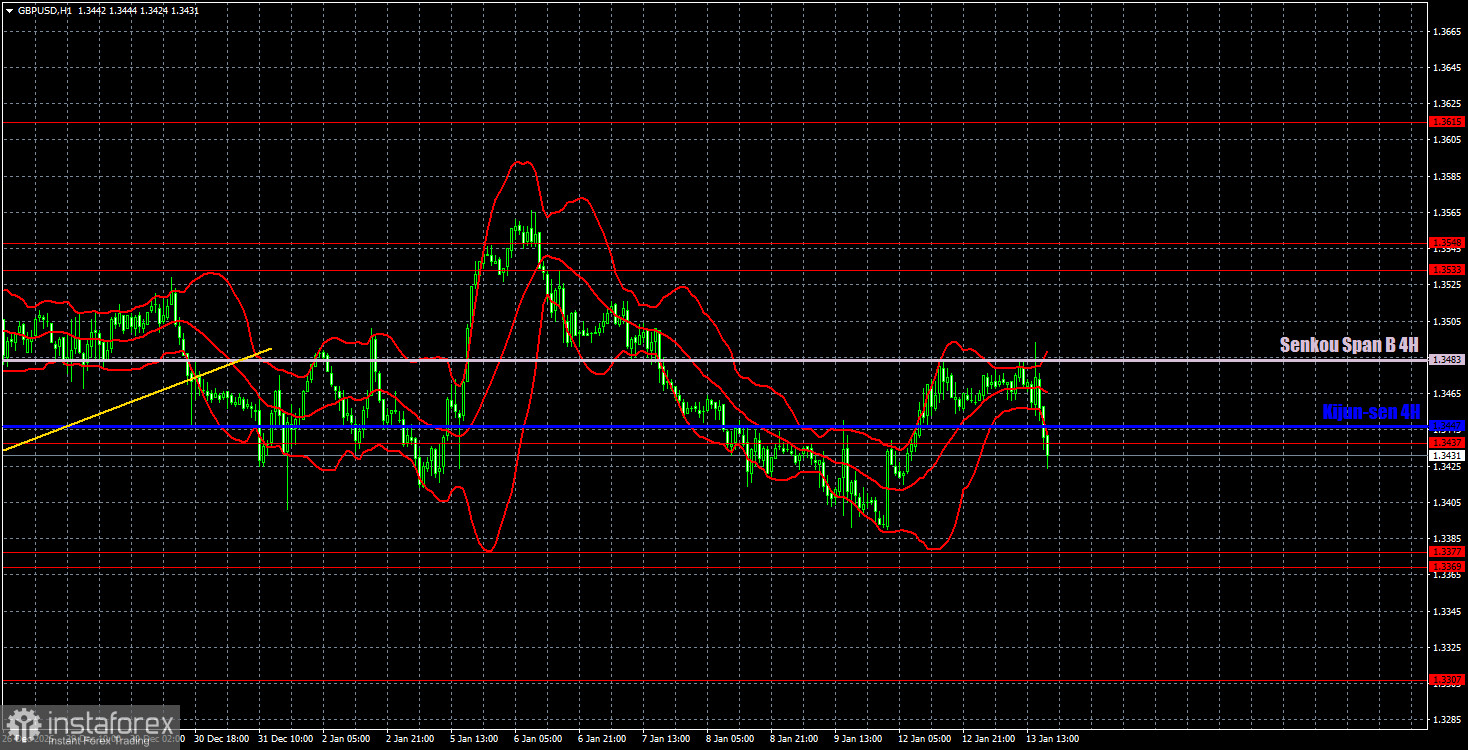
فی گھنٹہ ٹائم فریم پر،برطانوی پاؤنڈ/امریکی ڈالر کا جوڑا ٹرینڈ لائن کی خلاف ورزی کے باوجود اوپر کا رجحان بنا رہا ہے۔ ہمیں یقین ہے کہ مقامی میکرو اکنامک اور بنیادی پس منظر سے قطع نظر پاؤنڈ کا وسط مدتی اضافہ جاری رہے گا۔ اس وقت یورو، جو تین ہفتوں سے گر رہا ہے، پاؤنڈ کو نیچے کھینچ سکتا ہے۔ نیز، پاؤنڈ سینکو اسپین بی لائن پر قابو پانے میں ناکام رہا۔
14 جنوری کے لیے، ہم مندرجہ ذیل اہم سطحوں کو نمایاں کرتے ہیں: 1.3042–1.3050، 1.3096–1.3115، 1.3201–1.3212، 1.3307، 1.3369–1.3377، 1.3437، 1.3537–1.3535، 1.3533 1.3681، 1.3763۔ Senkou Span B (1.3483) اور Kijun-sen (1.3447) لائنیں بھی سگنل کے ذرائع ہو سکتی ہیں۔ قیمت کے 20 پِپس کو سازگار سمت میں لے جانے کے بعد سٹاپ نقصان کو بریک ایون پر منتقل کرنے کی سفارش کی جاتی ہے۔ Ichimoku اشارے کی لکیریں دن کے دوران بدل سکتی ہیں، جنہیں ٹریڈنگ سگنلز کا تعین کرتے وقت دھیان میں رکھنا چاہیے۔
بدھ کے روز، برطانیہ میں کوئی بڑی رپورٹس یا واقعات طے نہیں کیے گئے ہیں، جبکہ امریکہ خوردہ فروخت اور پروڈیوسر کی قیمت کی رپورٹیں جاری کرے گا۔ ان اعداد و شمار میں مارکیٹ کی نقل و حرکت کو بھڑکانے کا بہت کم امکان ہے۔ ٹرمپ کے پاس موقع بہت زیادہ ہے۔
تجارتی تجاویز:
آج، تاجر مختصر پوزیشنوں پر رہ سکتے ہیں، کیونکہ قیمت سینکو اسپین بی اور کیجون سین علاقوں سے اچھال گئی ہے۔ ہدف — 1.3369–1.3377 علاقہ۔ اگر قیمت 1.3533–1.3548 علاقے کے ہدف کے ساتھ Senkou Span B لائن کے اوپر مضبوط ہو جائے تو لمبی پوزیشنیں متعلقہ ہو جائیں گی۔
تصاویر کی وضاحت:
قیمت کی حمایت اور مزاحمت کی سطح (مزاحمت/سپورٹ) — موٹی سرخ لکیریں جن کے قریب حرکت ختم ہو سکتی ہے۔ وہ تجارتی سگنل کے ذرائع نہیں ہیں۔
Kijun-sen اور Senkou Span B لائنیں — Ichimoku انڈیکیٹر لائنیں 4 گھنٹے سے گھنٹہ وار ٹائم فریم میں منتقل ہوتی ہیں۔ وہ مضبوط لکیریں ہیں۔
ایکسٹریم لیولز — پتلی سرخ لکیریں جن سے قیمت پہلے باؤنس ہوئی تھی۔ وہ تجارتی سگنل کے ذرائع ہیں۔
پیلی لکیریں — ٹرینڈ لائنز، ٹرینڈ چینلز، اور کوئی اور تکنیکی پیٹرن۔
COT چارٹس پر انڈیکیٹر 1 — ہر تاجر کے زمرے کی خالص پوزیشن کا سائز۔