Analysis of EUR/USD 5M
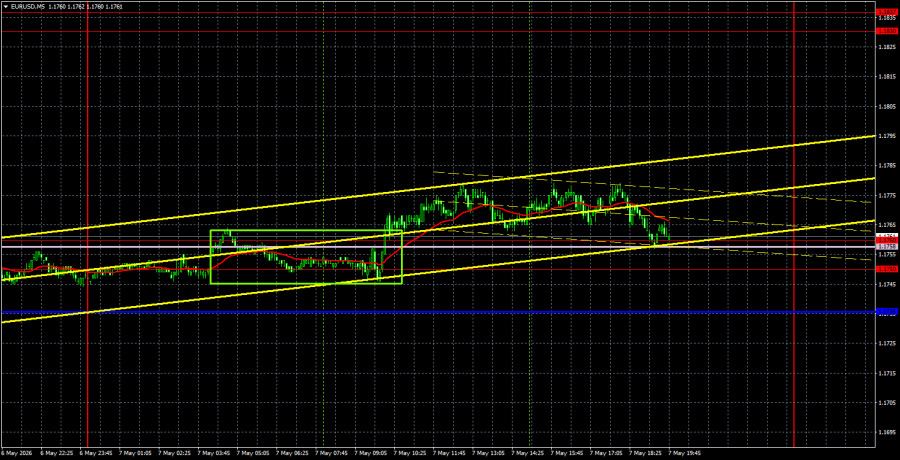
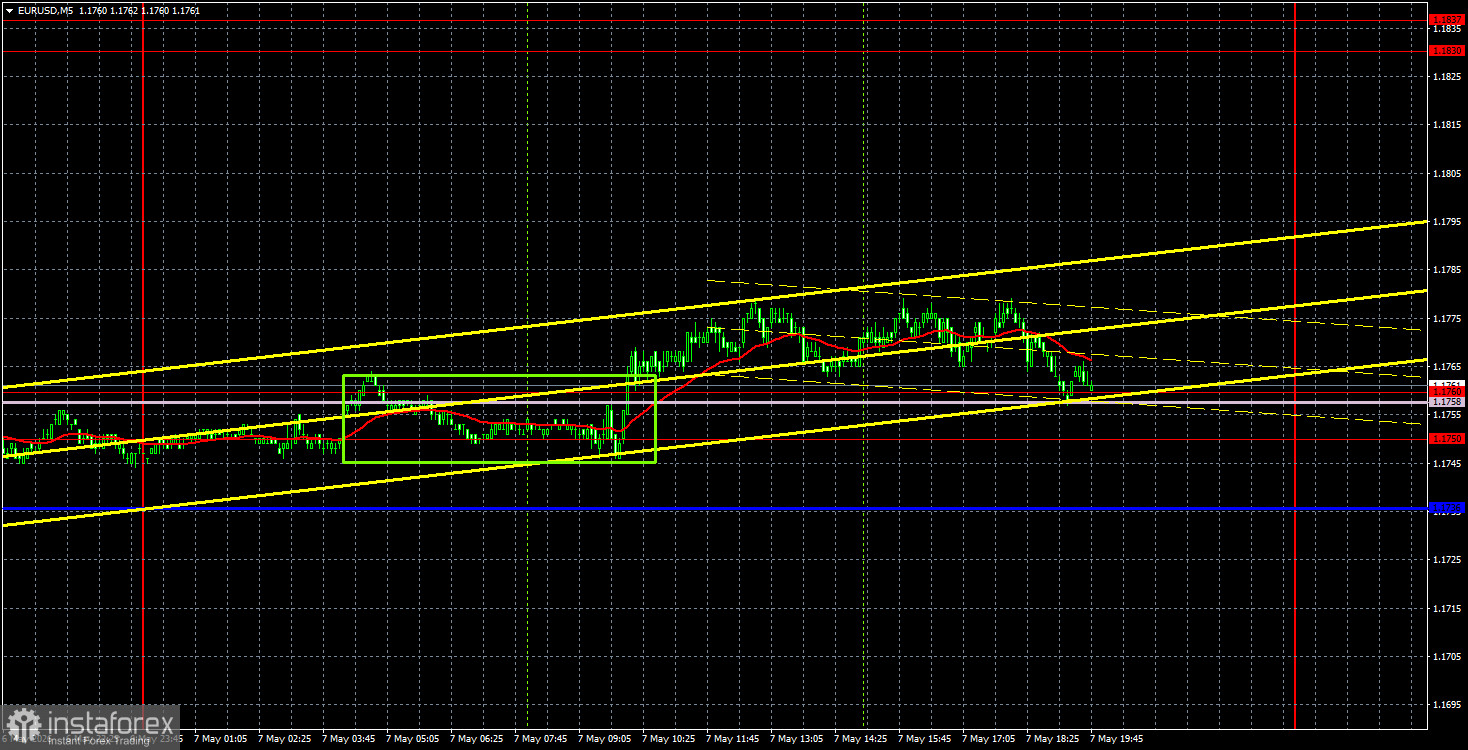
The EUR/USD currency pair traded with low volatility and little enthusiasm on Thursday. It was only during the North American trading session that we observed any semblance of market movement, which was unlikely to be driven by a single report on jobless claims from the US. Even the evening movements do not qualify as "strong." For most of the day, the pair spent time above the area of 1.1750-1.1760 and even above the Senkou Span B line. However, the nature of the movement remains the same—practically flat with a minimal upward slope. The market continues to swing between opposing forces, reacting to contradictory geopolitical news. Just on Monday, the market was preparing for a new war in the Middle East, and by Wednesday, it was celebrating an agreement between Iran and the US that has yet to be finalized. Today, the pair may move downward if US data exceed forecasts and may continue to rise otherwise. It is also important to remember that geopolitical news can emerge at any time and leave its mark on the charts.
From a technical standpoint, as mentioned, a semblance of an upward trend remains, despite the recent breach of the ascending trend line. Thus, we believe the market is currently flat. There is no clearly defined upward course for the price. The Ichimoku indicator lines are weak in this flat environment.
On the 5-minute timeframe, one trading signal was generated on Thursday. During the European trading session, the pair crossed the 1.1750-1.1760 area, allowing it to move up by a maximum of 10 pips. Volatility was extremely low, so expecting good profits was not feasible.
COT Report
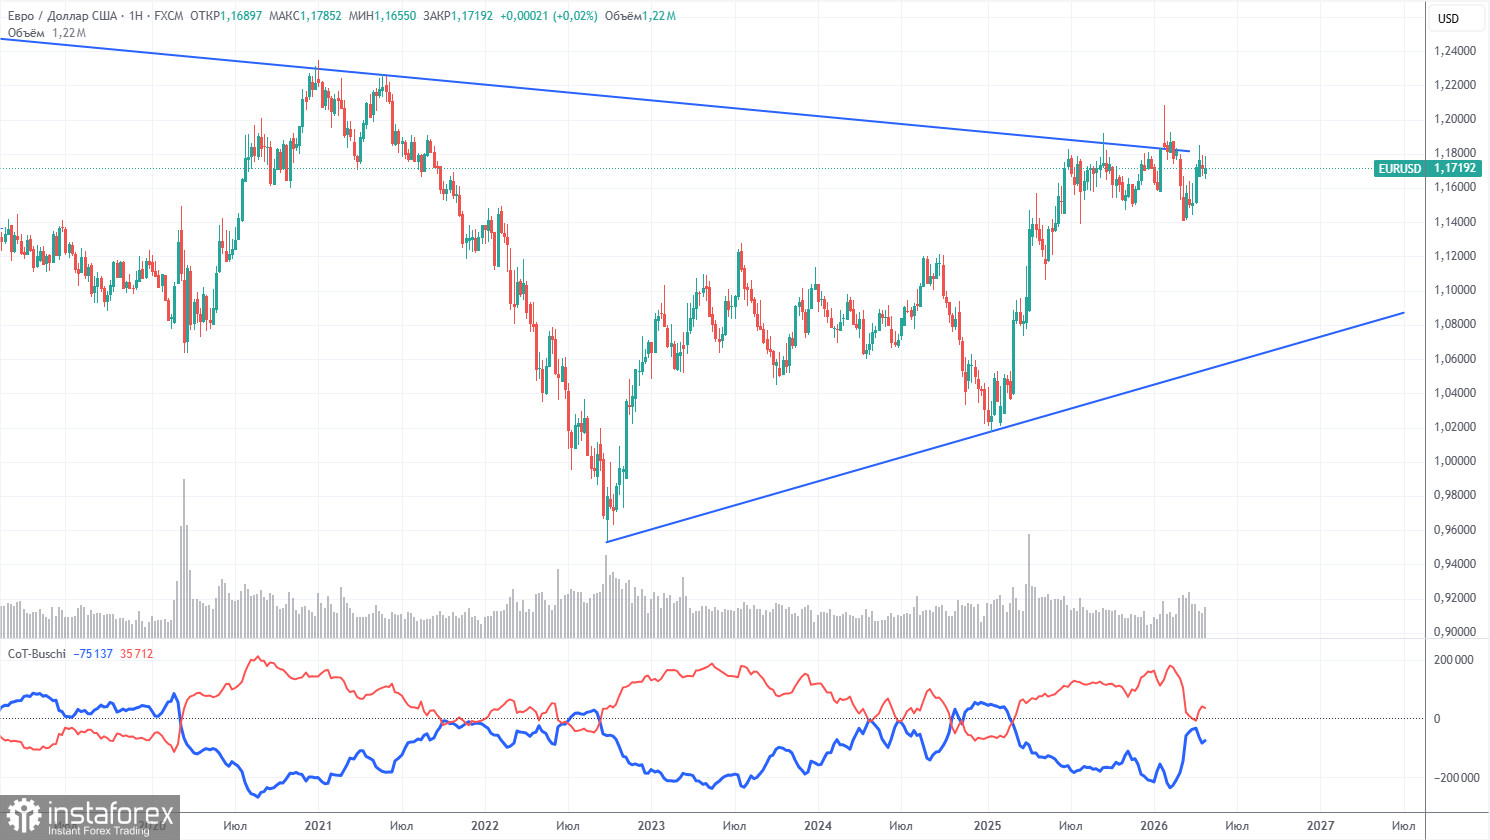
The latest COT report is dated April 28. The illustration of the weekly timeframe clearly shows that the net position of non-commercial traders remains "bullish," but is rapidly declining amid geopolitical events. Traders have been shedding the European currency in favor of the US dollar in recent months. Trump's policies have not changed, but the dollar has temporarily served as a "reserve currency." However, this process may already be behind us.
We still do not see any fundamental factors supporting a strengthening of the euro, while there are plenty supporting a decline in the US dollar. The war in the Middle East made the dollar temporarily very attractive, but once this factor reaches its "expiration date," everything will revert to previous patterns. This expiration may already have occurred. In the long term, the euro could decline to $1.06 (the trend line), but the upward trend will remain relevant. At present, the pair has not strayed too far from the descending trend line, which has been breached several times.
The positioning of the red and blue lines indicates parity between bulls and bears. Over the last reporting week, the number of longs among the "Non-commercial" group decreased by 300, while shorts increased by 5,300. Consequently, the net position decreased by 5,600 contracts over the week.
Analysis of EUR/USD on 1H
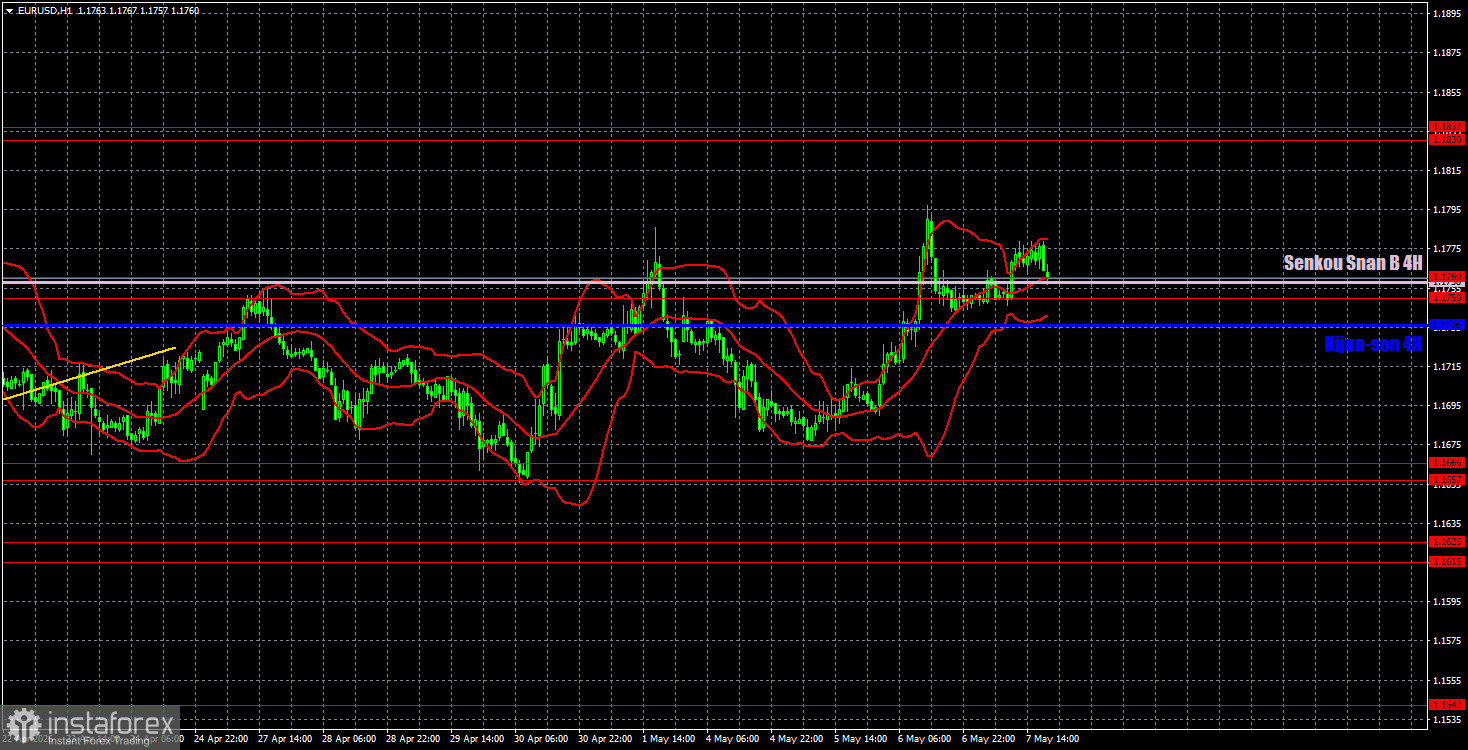
On the hourly timeframe, the EUR/USD pair has been trading in a range since April 21. The situation in the Middle East remains tense but is not worsening, so there are currently few substantial reasons for the US dollar to strengthen further. Technically, the dollar is in a better position than the euro, but this advantage has not been realized last week and is not materializing this week either.
For May 8, we highlight the following trading levels: 1.1362, 1.1426, 1.1542, 1.1615-1.1625, 1.1657-1.1666, 1.1750-1.1760, 1.1830-1.1837, and 1.1907-1.1922, as well as the Senkou Span B line (1.1758) and the Kijun-sen (1.1736). The lines of the Ichimoku indicator may shift throughout the day, which should be taken into account when determining trading signals. Don't forget to set a Stop Loss order to break even if the price moves in the correct direction by 15 pips. This will protect against potential losses if the signal turns out to be false.
On Friday, a less significant retail sales report is scheduled for publication in the Eurozone, while the US will release key Nonfarm Payroll and unemployment reports. Additionally, average wages and the Michigan Consumer Sentiment Index will also be released in the US. Therefore, significant market movements may occur following the release of the Nonfarm report.
Trading Recommendations:
Today, traders may consider opening short positions if the price consolidates below the 1.1750-1.1760 area, targeting 1.1657-1.1666. Long positions can be initiated on a rebound from the area of 1.1750-1.1760, targeting 1.1830-1.1837.
Explanation of Illustrations:
- Support and resistance price levels (resistance/support) – thick red lines around which movement may end. They are not sources of trading signals.
- Kijun-sen and Senkou Span B lines – lines of the Ichimoku indicator transferred to the hourly timeframe from the four-hour. They are strong lines.
- Extremity levels – thin red lines from which the price had previously rebounded. They are sources of trading signals.
- Yellow lines – trend lines, trend channels, and any other technical patterns.
- Indicator 1 on COT charts – the size of the net position of each category of traders.